Report: Reactivations
Description
 |
 |
Activities using this report
|
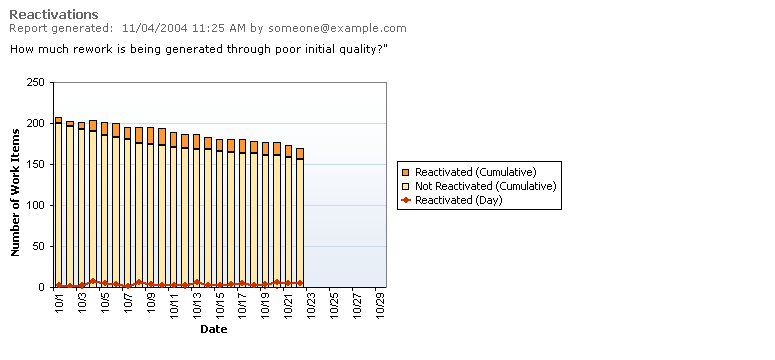
How many work items are being reactivated? Reactivations are work items that have been resolved or closed prematurely. A low rate of work item reactivations (for example, less than 5%) might be acceptable, but a high or rising rate of reactivation should warn the project manger to diagnose the root cause and fix it.
Healthy Example

The total rate of work item reactivation is low and does not rise during the iteration. This small amount of noise may be acceptable. Of course, the lower the rate, the better.
Data Series
| Line |
Description |
|
Chart Height |
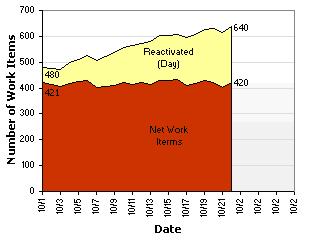
- The top line of this graph shows the total work items of the selected types (e.g. bugs) resolved in the team build.
|
|
Reactivated |
- The height of top area is the number of reactivations; i.e. work items previously resolved or closed that are now active again.
|
|
Net Work Items |
- The height of the lower area is the difference between the total work items resolved and the reactivated work items.
|
Unhealthy Examples

This reactivation report shows a high and rising rate of bug fixes that were rejected in testing. This trend will consume considerable resource time for no visible customer benefit.


